Tuesday, 2 December 2014
http://www.thestar.com.my/Business/Business-News/2014/12/02/How-low-will-crude-go/?style=biz
If you think the bears still have a grip on oil, then you should continue to unload, grab the money and sit on the sidelines waiting for the next entry at cheaper levels.On the other end of the spectrum, if the so-called bear run has completed its course and makes a u-turn heading north again, then one should buy at current levels and buy more.
Light sweet crude, also known as the West Texas Intermediate and traded on the New York Mercantile Exchange (Nymex), started the downward spiral at the US$107.73 level on June 20, owing to an apparent profit-taking activity.
What appeared to be a typical correction process then subsequently turned sour, as news about soft demand and oversupply dampened sentiment.
Soft market: A market that has more potential sellers than buyer; a buyer's market, as the purchasers hold much of the power in negotiations.
Against the negative backdrop, the black
commodity continued to bleed in Asia, trading on extended liquidation
pressure yesterday.
Liquidating market: Consider a housing bubble, in
which real estate prices are continually bid up. Once the bubble bursts, investors stop buying into real estate
and begin selling their holdings. This creates the aggregate
effect of a sell-off in the real estate market as a whole, which would
display relatively low prices on houses and strong selling pressure. In
this case, the real estate market would be said to be a liquidating
market, as most of the market's participants are chiefly interested in
liquidating their assets into cash at that time.
The prevailing trend is overwhelmingly bearish, with prices flirting sharply below the lowest 14-day simple moving average line and the multiple “death crosses” on radar screens staying intact.
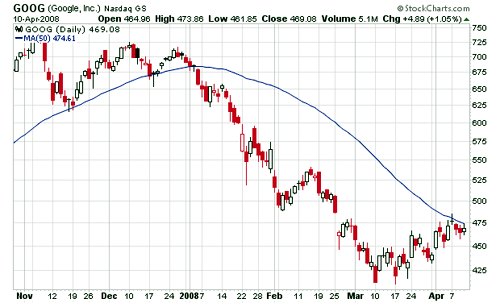
Simple Moving Average (SMA): Prices rarely move in a straight line. Therefore, moving-average lines are used to help a trader more easily identify the direction of the trend.
 |
| Figure 1: A simple moving average in Google Inc. |
When the price crosses below a moving average, it can be used as a simple trading signal. A move below the moving average (as shown above) suggests that the bears are in control of the price action and that the asset will likely move lower. Conversely, a cross above a moving average suggests that the bulls are in control and that the price may be getting ready to make a move higher.
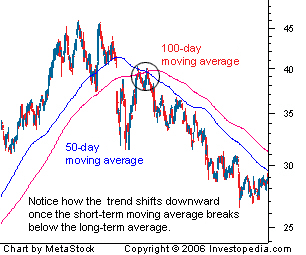
Multiple “death crosses” on radar screens: A crossover resulting from a security's long-term moving average breaking above its short-term moving average or support level.

As long-term indicators carry more weight, this trend indicates a bear market on the horizon and is reinforced by high trading volumes. Additionally, the long-term moving average becomes the new resistance level in the rising market.
Under such circumstances, any rebound due to the grossly oversold reason is not sustainable, only creating an opportunity for bearish investors to sell into strength, unless a clear positive catalyst emerges.
Bearish investors: If an investor were bearish on the S&P 500 they would attempt to profit from a decline in the broad market index. Bearish sentiment can be applied to all types of markets including commodity markets, stock markets and the bond market.
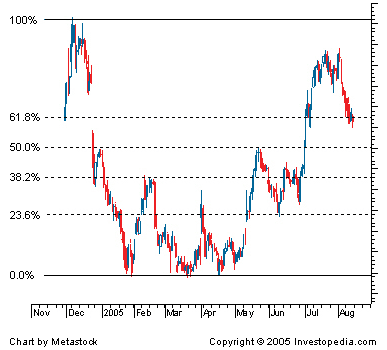
Based on the daily chart, crude oil prices had violated the default measurement of 23.6%, 38.2% and the 50% of the Fibonacci retracement and are now approaching the 61.8% pullback of the previous bull rally, from US$32.40 on Dec 19, 2008, to US$114.83 on May 2, 2011.

No comments:
Post a Comment